Set your Grid and Zone
Step-by-Step Guide:
1) Click the Document tab, then select the Grid icon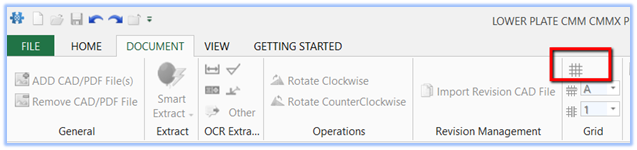
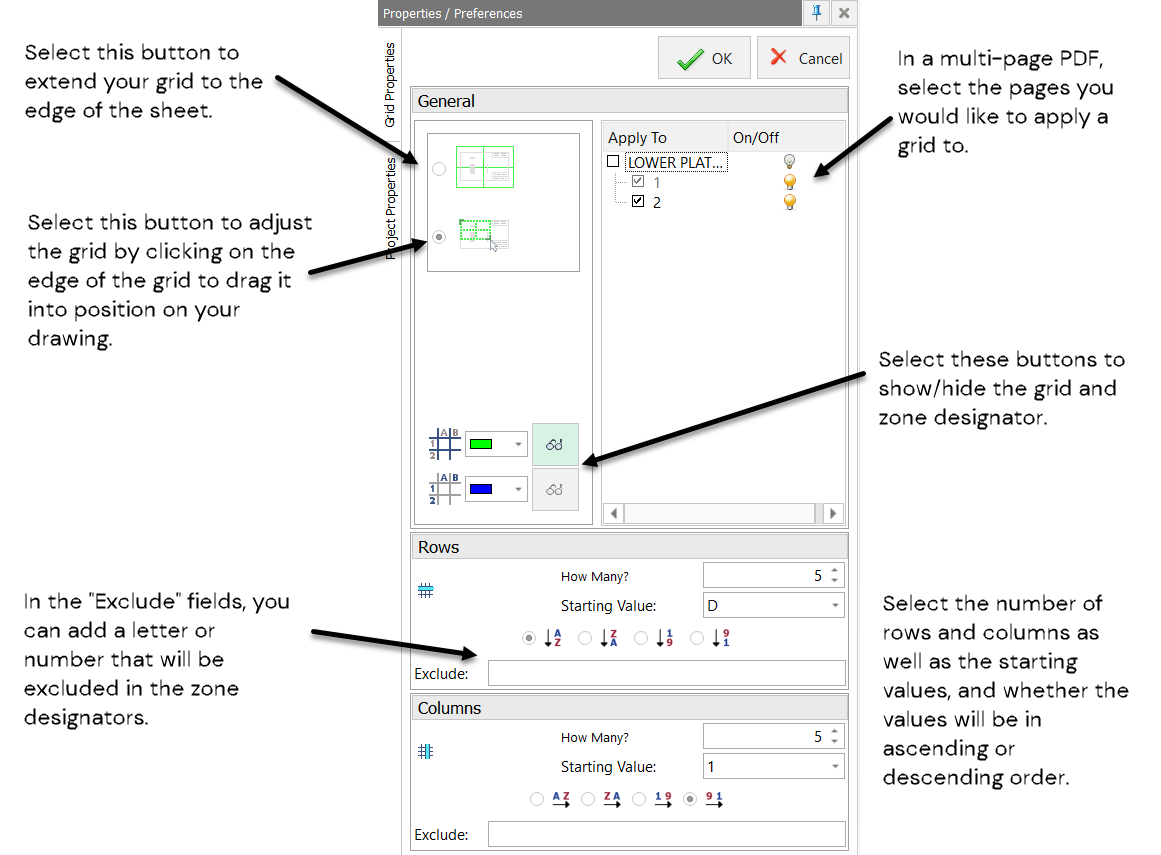
2) A grid will be applied to your drawing, and you'll see the grid properties panel on the left.
3) Here you'll find options that allow you to:
- Select the pages of a multi-page PDF you would like to apply the grid to
- Adjust the size of your grid
- Show/Hide the grid and Zone designator
- Select the number of rows and
columns, as well as the starting values, and whether the values will be
in ascending or descending order.
- Be sure to select "OK" when done setting your grid
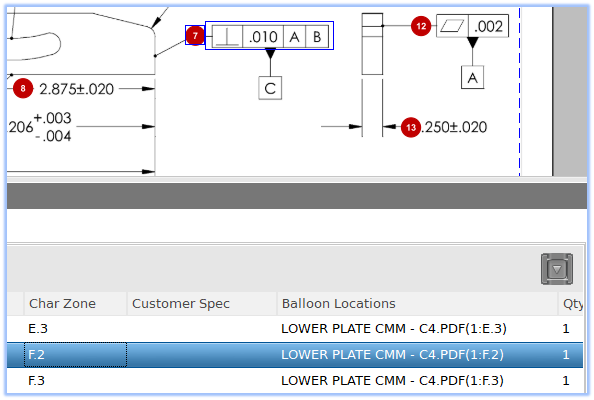
4) If you choose to hide your grid, the "Char Zone" and "Balloon Location" will still be available in your table manager, and the values can be extracted into your Excel report.
Related Articles
Set Default Tolerances
Step-by-Step Guide: Click on the 'Home' tab located in the upper left-hand corner Select 'Options' Go to 'Project Options' Click on 'Characteristic' Go to the 'Default Tolerances' section Click on 'Linear', 'Angular' or add a custom tolerance by ...Can I share a license with multiple users?
Yes, InspectionXpert is licensed on a concurrent use basis (like a network license). You can set up InspectionXpert on multiple computers. The number of users who can open the software simultaneously depends on the number of subscriptions you have.Setting your Balloon Options and Appearance
There are three ways that balloon settings or options can be modified: 1. through the InspectionXpert "Options" window: It's recommended that you set your project balloon options such as color, text size, etc. in the "Ballooning Options" window. To ...